Go Beyond the Price.
Master Tokenomics.
Our Token Statistics Simulator is your data-driven sandbox for understanding the 'why' behind token value and price movements. Don't invest blindly—simulate the metrics first.
Empowering investors to analyze:
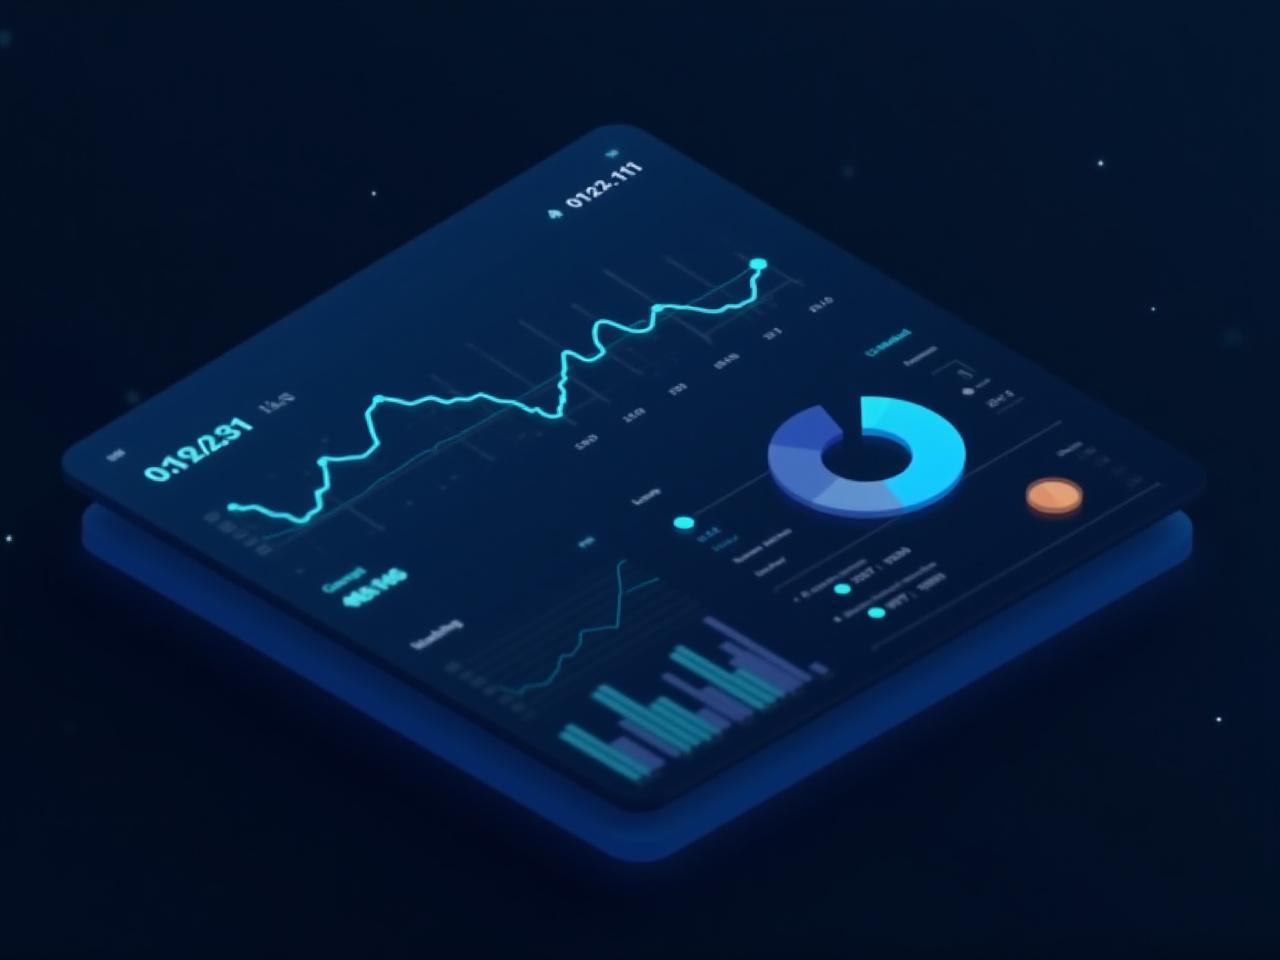
Interactive Market Cap & Valuation
Ever wonder what 'fully diluted market cap' actually means? Or why a cheap token price doesn't mean a cheap project?
Learn the critical difference between Circulating Supply, Total Supply, and Max Supply. Use our intuitive sliders to see how changes in token price and supply affect the Market Cap and Fully Diluted Valuation (FDV).
Key Learning Goal
Understand why a low current market cap combined with a massive FDV can be a major red flag for long-term investors.

Visualize Token Allocation & Distribution
A project's success often depends on who holds the tokens. Our simulator uses interactive pie charts to break down the token allocation with granular detail.

Team Allocation
Analyze how much the founders hold and ensure incentives align with long-term growth.
Public Sale
See the immediate supply hitting the market during the launch event or IDO.
Ecosystem Fund
Evaluate funds set aside for marketing, partnerships, and liquidity rewards.
Simulate Vesting Schedule Impact
Massive token unlocks can create huge selling pressure, causing prices to dip unexpectedly. Our vesting simulator plots all future token unlocks on a clear timeline against the total supply.
-
Spot 'Token Cliffs':
Identify specific dates where private investors or the team get access to large chunks of tokens.
-
Analyze Emissions:
Visualize how linear vesting schedules result in more stable price action compared to bulk unlocks.

Understand Liquidity & Price Impact
Liquidity is the lifeblood of a token. Our simulator lets you mimic large trades to see how fragile or robust a token's price actually is.
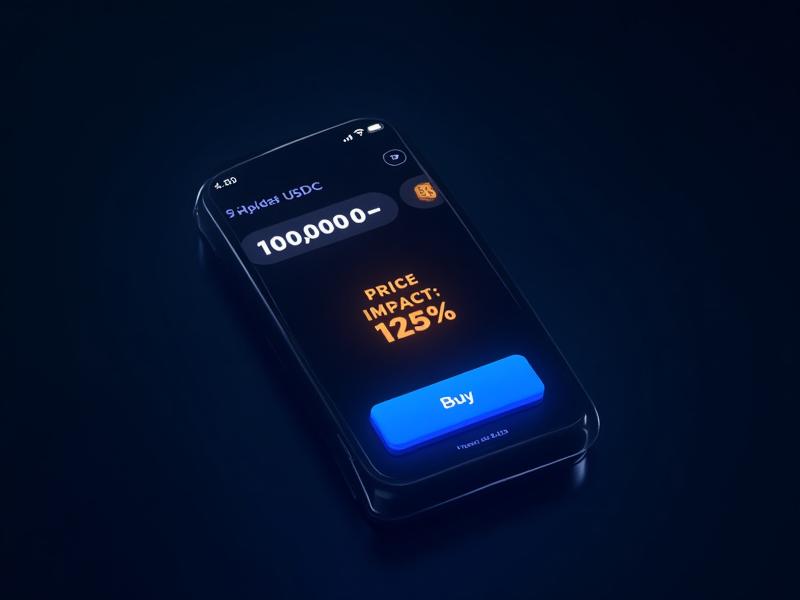
"Entering a $10,000 buy order on this low-liquidity pool would raise the price by 12% instantly."
Ready to Become a Tokenomics Pro?
Stop guessing and start analyzing. Get hands-on with the data that drives crypto markets in a risk-free environment.
Request Early Access